on
Post-Election Reflection on Model
This blog is part of a series for Gov 1347: Election Analytics, a course at Harvard University taught by Professor Ryan D. Enos.
Introduction
What an election.
As of November 22, already two weeks since Election Day, votes are still being counted, leaving several close races in the House of Representatives and one race in the Senate yet to be decided. What has been decided is the balance of power in the upcoming congress - Democrats narrowly held on to the Senate, but Republicans narrowly succeeded in winning control of the House, ending four straight years of Democratic control in the lower chamber.
In the Senate, every Democratic incumbent so far has won reelection, and in Pennsylvania’s open race for retiring Republican Senator Pat Toomey’s seat, Lieutenant Governor John Fetterman flipped the seat for the Democrats. With this flip, Democrats will have won at least 50 seats and therefore control of the Senate (thanks to Vice President Kamala Harris’ tie-breaking vote), regardless of what happens with the Georgia runoff on December 6, which was scheduled because neither incumbent Democratic Senator Raphael Warnock nor Republican challenger Herschel Walker won the required 50% of the vote in the first round of voting, forcing a runoff under Georgia law. If Warnock holds on, Democrats will end up with 51 seats, meaning they will have netted one seat this election.
In the House, Republicans did manage to win control, but just barely! As of this post, Republicans have won 219 seats, one seat more than the minimum of 218 required for control. If each of the current uncalled House races break for the currently leading candidate, Republicans will end up with 222 seats, while Democrats will end up with 213 seats. Despite the possibility of a “red wave” election that would follow the traditional pattern of the incumbent President’s party losing many seats during midterm years, Republicans will only walk away with no more than a five-seat majority in the House and no possibility of Senate control.
Model Recap
So how did my overall model do?
To recap, I made two national-level models with the same independent variables, with one predicting the Democratic two-party vote share in the House and the other predicting the number of seats won by Democrats in the House. Leaving out 2020 data due to the extraordinary circumstances of that election from the COVID-19 pandemic, I chose to use four independent variables: percent change in the unemployment rate the quarter before the election, percent change in real disposable income (RDI) the quarter before the election, average generic ballot support for Democrats, and the incumbent party of the president. Taking a linear regression for each model, I found that only the latter two variables had a statistically significant effect on vote share/seat share, with more generic ballot support for Democrats translating to more votes and seats for Democrats and an incumbent Democratic president causing a decrease in votes and seats for Democrats.
The vote share model predicted that Democrats would win about 49.70% of the vote, while the seat share model predicted that Democrats would win about 215 seats. Before the election, I privately considered both of those outcomes to be too optimistic for the Democrats, thinking that my models were not seeing the incoming “red wave.” Two weeks later, my models are a lot closer to reality than I ever expected, especially the seat share model.
Model Accuracy
Vote Share Model
According to the most recent 2022 results data provided by Professor Enos for both contested and uncontested elections, my vote share prediction of 49.70% was 1.58% higher than the actual vote share as of this post. 1.58% is not a big gap, which means my model did not do too badly in overestimating Democratic support, though many of my wonderful classmates got much closer with their models. When looking at just contested elections, my model’s prediction is only 0.33% higher than the real vote share, though since I focused on predicting votes and seats on the national level, I want to include all elections when evaluating my models.
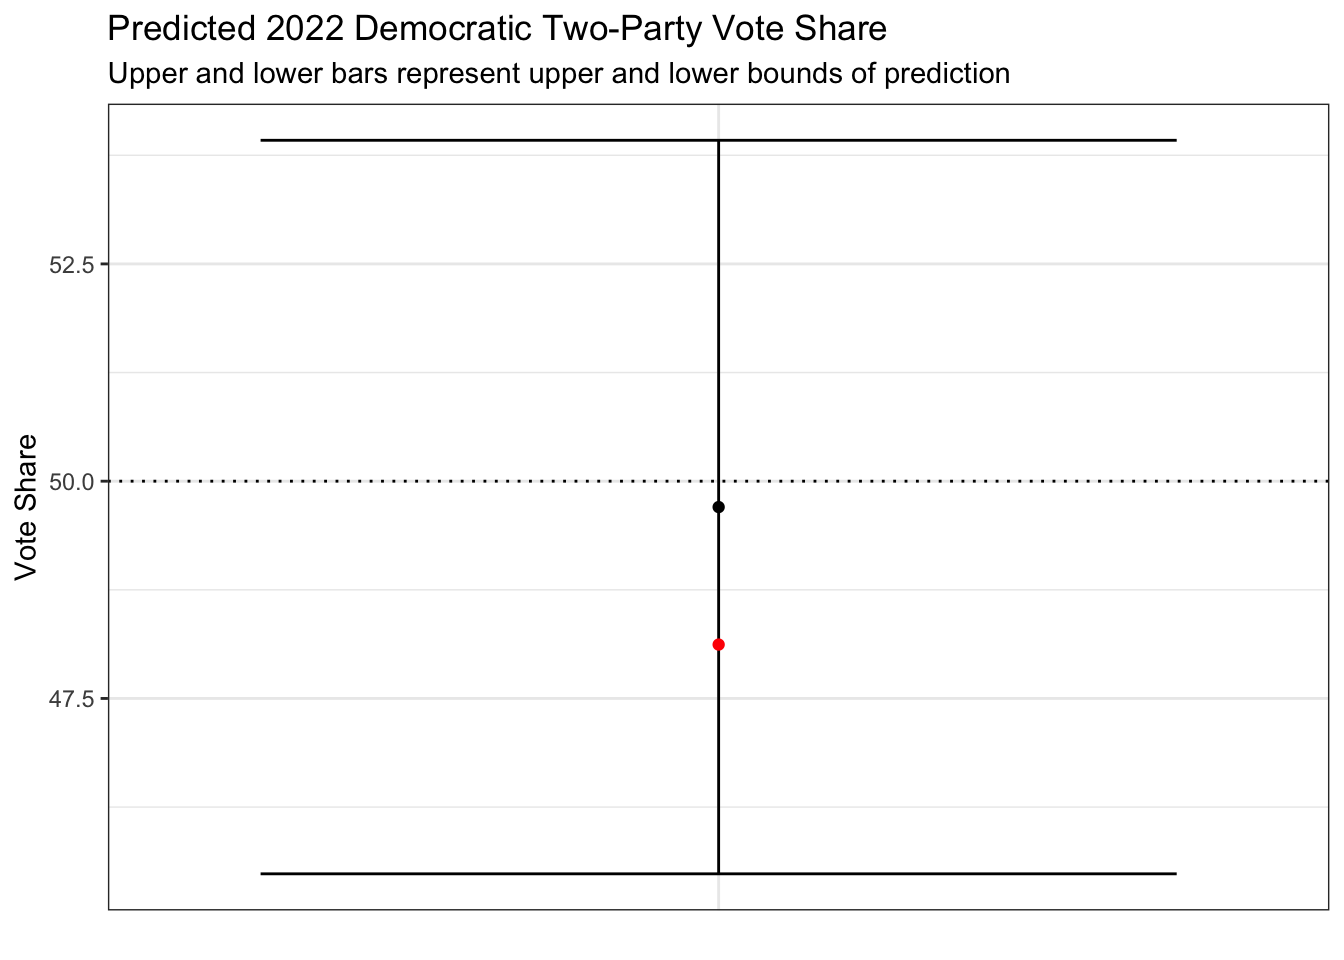
The above plot is a visualization of my model’s final vote share prediction and the confidence interval. The black dot is the predicted result, and the red dot is the actual result as of November 22. As you can see, my confidence interval was quite wide, but in the end, I wasn’t incredibly far off from the actual vote share, and I still predicted Democrats would not win a majority of the popular vote.
Seat Share Model
According to the current results, my seat prediction gives Democrats two more seats than the 213 they are predicted to win in the end. Before election night, I thought that 215 seats would be too optimistic to expect for Democrats to win in a midterm election stacked so against them, so I am quite surprised to see that my seat prediction is so close.
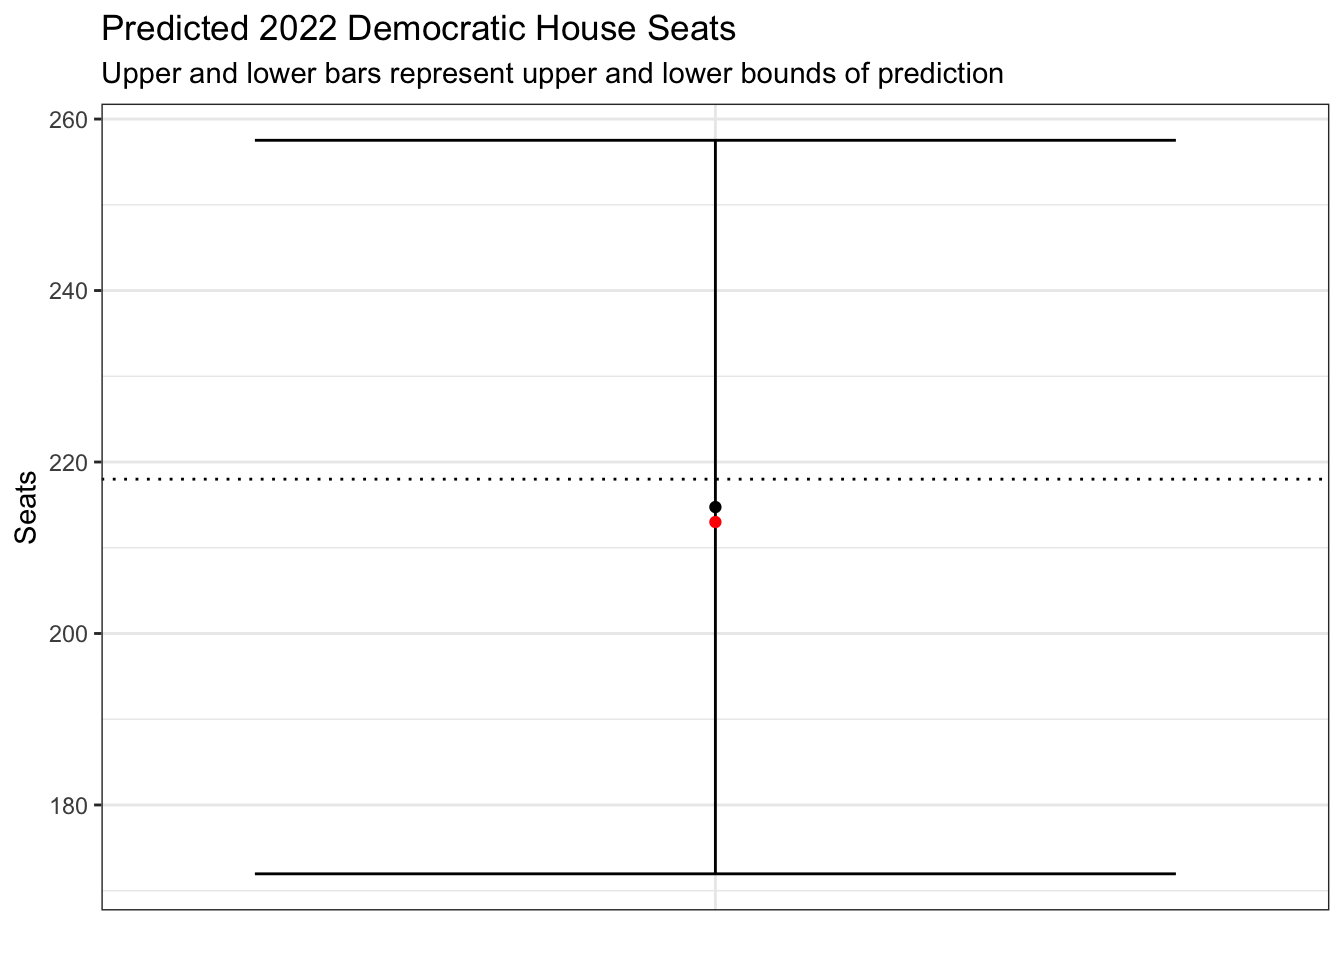
In this plot, you can see the dots are much closer together than the vote share model, even as my confidence interval is extremely wide. I still predicted correctly that Democrats would lose their majority in the House.
What and Why Did My Models Miss?
My models were much more accurate than I expected, but there is no doubt that they were flawed. No model is perfect of course, and I can’t possibly account for every possible variable, but I believe it’s important to reflect on any potential blind spots in the models.
The set of independent variables that I chose were based on the assumption that economic conditions, generic ballot polls, and Democratic incumbency would be the most important factors in people’s decision on which party to vote for. I was not too far off in my predictions, but however, I have two major hypotheses for why my models were not more accurate and confident (my confidence intervals were quite wide, especially for seats). Both of my models overpredicted Democratic performance, and my two hypotheses suggest I should have been more bullish on Democrats’ chances, but I believe these hypotheses could have at least improved my model’s preciseness for predicting both votes and seats.
Dobbs v. Jackson and the Salience of Abortion
In one previous post, I mentioned that if the election were held in August, Democrats would’ve been in the strongest possible position since they were riding the wave of momentum caused by the Supreme Court’s overturning of Roe v. Wade, throwing the decision of whether abortions should be legal back to the states and thus leading to millions of people losing access to abortions. As the election got closer, I thought that the effect of this decision would fade and economic issues like inflation and rising gas prices would once again be more important for people’s vote choices.
As it turns out, abortion remained a highly important issue for many voters, even compared to the economy. According to CNN’s national exit polls on election night, 31% of voters said that inflation was the most important issue, but abortion came at a very close second at just 27%. In some key states like Michigan and Pennsylvania where Democrats did very well overall, abortion was actually the most important issue for a plurality of voters.
My main takeaway from this hypothesis is that the shock of Dobbs was much longer lasting than I expected. If I had accounted for abortion more in my final model (and had chosen better variables for measuring inflation), I would have likely gotten more accurate and confident predictions.
It’s Still Kinda The Economy, Stupid
The economic variables in my model were not statistically significant, but this does not mean that economic issues did not matter at all. It’s quite possible that the variables I used were not good predictors of people’s feelings about the economy, which means I likely should have chosen different variable(s) for measuring economic issues like inflation, which still remained as the most or second most important issue to voters in many states.
Based on the exit polls I cited above, most voters who said abortion was their top issue voted Democratic, but most voters who said inflation was their top issue was inflation voted Republican, and as I said above, many, many voters cared the most about inflation. I believe that my model overestimated Democratic support because I did not measure inflation as well as I could have.
Proposed Tests
How would I test these hypotheses?
For abortion, I might try to incorporate polling specifcally on people’s views on abortion and/or the Dobbs decision. If enough of these polls were available on both the national level and on the statewide level, I could have a strong predictive variable for predicting Democratic support. Since the effects of Dobbs are not evenly felt across the country, I might also want to use data based on state-by-state abortion restrictions to account for the possibility that abortion was more of a boost to Democrats in some cases compared to others.
For inflation, I would want to find the right data to measure inflation and the different impacts it may have had on a state-by-state basis. I would test out an inflation variable, maybe by looking at just the raw number or the percent change right before the election. I might also look at combining inflation with another different economic variable, like gas prices.
Conclusion
In summary, what would I change?
Firstly, I would try to incorporate abortion more into my model, seeing as the impact of Dobbs is much longer lasting than many other political shocks. I would also work on improving how I incorporate economic variables into my model, focusing especially on adding a good inflation variable. Besides these changes, I am confident in continuing to factor in incumbency and generic ballot polling, and seeing as I was not too far off in the end, I believe that these changes alone would already greatly improve my predictions.