on
Blog Post 7 - Shocks
This blog is part of a series for Gov 1347: Election Analytics, a course at Harvard University taught by Professor Ryan D. Enos.
Introduction
Up until this week, we have looked at more “predictable” factors that go into predicting election outcomes. For my 2022 model, I’ve explored incorporating everything from economic variables and polling to expert predictions and ad spending.
What about “shocks?” As we learned, shocks can be a major, nationwide phenomenon, such as the Dobbs v. Jackson Supreme Court decision, or shocks can be more local and candidate-specific, like the story that broke about Republican Senate candidate Herschel Walker paying for a girlfriend’s abortion despite his pro-life stance. Regardless, shocks are these often unexpected events that are seen as being capable of “shaking up the race.”
The degree to which these “shocks” influence the outcome of the election likely varies by the type of shock and - in my view - the timing of the shock. As we discussed before, Dobbs is a good example of a major political shock, as the national political environment shifted towards the Democrats significantly for several months. Had the midterms been held in August, I believe Democrats would have been in the strongest possible position since they would still be riding the wave of momentum from the decision early in the summer, but because of the timing of the election, enough time has passed that the impact of Dobbs has begun to slowly decrease. Still, Democrats are probably in a better position heading into election day thanks to Dobbs than they normally would be for a midterm where they are the party in power (where losing seats in both chambers is all but expected).
One example of timing that actually may have made a significant difference was back in the 2016 election, when former FBI director James Comey reopened the investigation into Hillary Clinton’s emails about a week before the election. Clinton’s poll numbers were strong throughout October, and it had seemed like the election would be hers to lose, but reopening the investigation just a week before the election tightened the race last minute, potentially contributing to Donald Trump’s shocking upset on election night.
Updated National Models
Shockingly (pun intended), even though this week was about shocks, this blog post will serve more as a major update to my 2022 model than a post about shocks themselves. Although shocks like Dobbs are certainly significant, I ultimately decided that for my final model I would leave out shocks entirely due to their unpredictable nature.
After continuing to play around with district-level forecasting, I also decided to return to forecasting on the national level, as I feel more confident in my ability to build a stronger national model in preparation for my final prediction, which will come out on November 7. Since I am sticking to a national-level prediction, I will not be doing a pooled model. In addition to national vote share, I will also now forecast national House seat share to paint a more complete picture of my election prediction.
For each of my models, I chose to focus on four independent variables. Special thanks to Luke Tomes for the “party_power” dataset; I used it for my incumbency variables!
1. Unemployment rate: Specifically, the unemployment rate in the last month before the election. I use the last month of unemployment data since it is what people will be experiencing at the time of the election.
2. Average Democratic generic ballot support: I focus on the last 100 days of polling before the election.
3. Incumbent party in the House: One of the incumbency variables measures whether Democrats are in control of the House at the time of the election. “1” means they are, “0” means Republicans control the House.
4. Incumbent party of the president: The other incumbency variable measures whether the incumbent president at the time of the election is a Democrat (1) or a Republican (0). This variable is included based on the conventional wisdom that midterm elections are bad for the incumbent president’s party.
| Characteristic | Beta | 95% CI1 | p-value |
|---|---|---|---|
| (Intercept) | 38 | 29, 47 | <0.001 |
| UNRATE | 0.03 | -0.48, 0.53 | >0.9 |
| avg_D_support | 0.30 | 0.13, 0.48 | 0.001 |
| house_incumb | 0.92 | -0.89, 2.7 | 0.3 |
| pres_incumb | -2.4 | -3.9, -0.77 | 0.005 |
| Adjusted R² = 0.468 | |||
| 1 CI = Confidence Interval | |||
Above is the regression output for the vote share model. As you can see, polls and the incumbent president’s party are the statistically significant variables in influencing Democratic vote share. In particular, one point of poll support boosts Dem vote share by 0.30%, while having an incumbent president who’s a Democrat decreases vote share by 2.4%. The adjusted R-squared is 0.468, one of the higher values I’ve been able to achieve for my national models.
| Characteristic | Beta | 95% CI1 | p-value |
|---|---|---|---|
| (Intercept) | 92 | 8.6, 176 | 0.032 |
| UNRATE | -0.35 | -5.0, 4.3 | 0.9 |
| avg_D_support | 2.9 | 1.3, 4.5 | <0.001 |
| house_incumb | 24 | 7.7, 41 | 0.005 |
| pres_incumb | -14 | -29, 0.12 | 0.052 |
| Adjusted R² = 0.549 | |||
| 1 CI = Confidence Interval | |||
Above is the regression output for the new seat share model. Polls are again a statistically significant variable, but interestingly, the incumbent party for the House, not the president, is statistically significant here. Every point of poll support translates to a gain of about 2.4 seats for Dems, while having control of the House results in a gain of 24 seats, which I can see happening due to the advantages that incumbents have compared to challengers during elections. The adjusted R-squared for this model is 0.549, even higher than the vote share model!
2022 Model Predictions
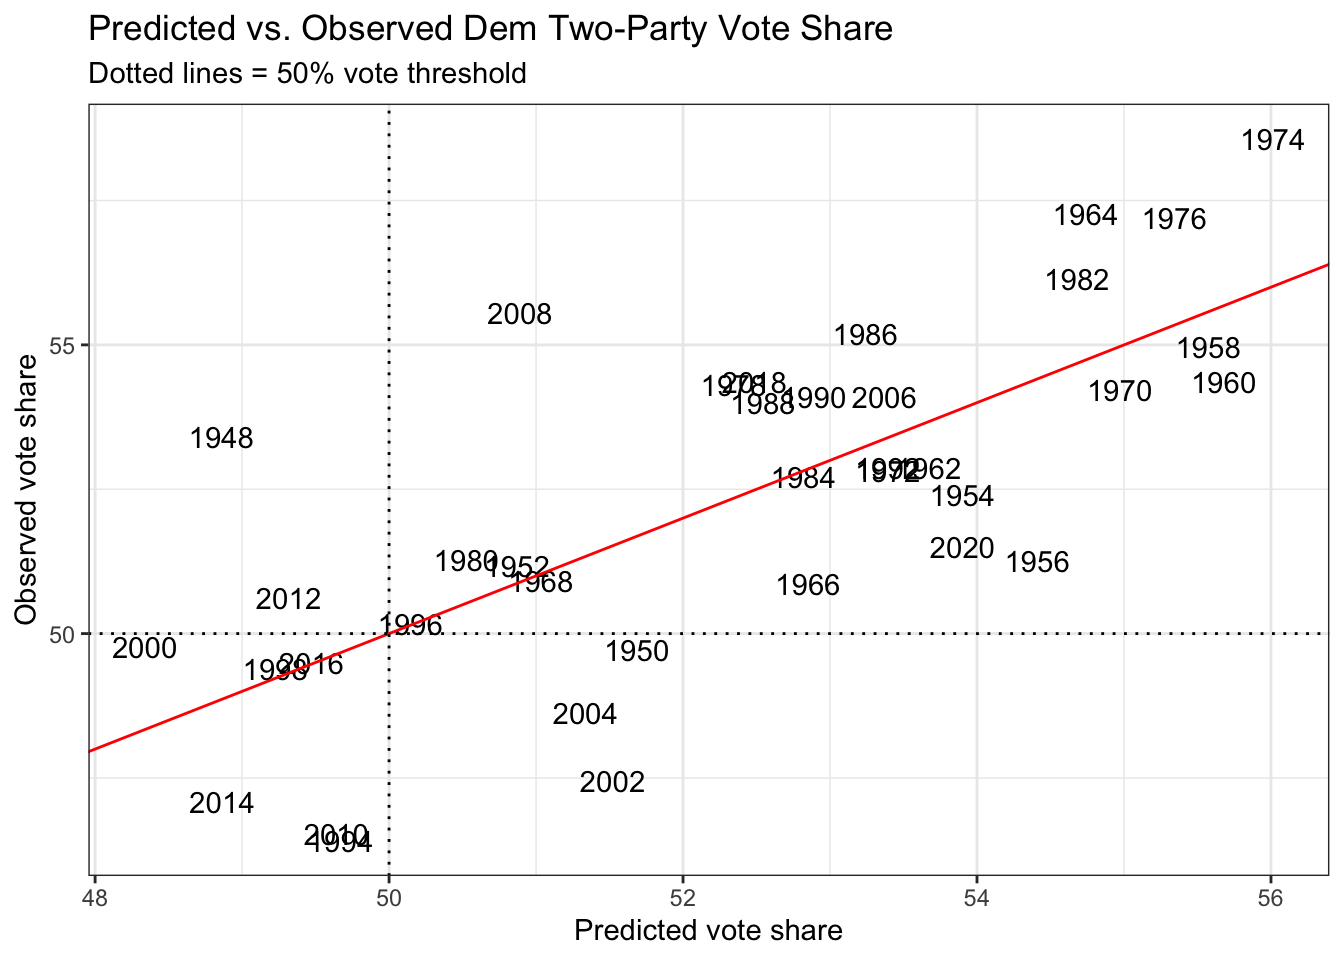
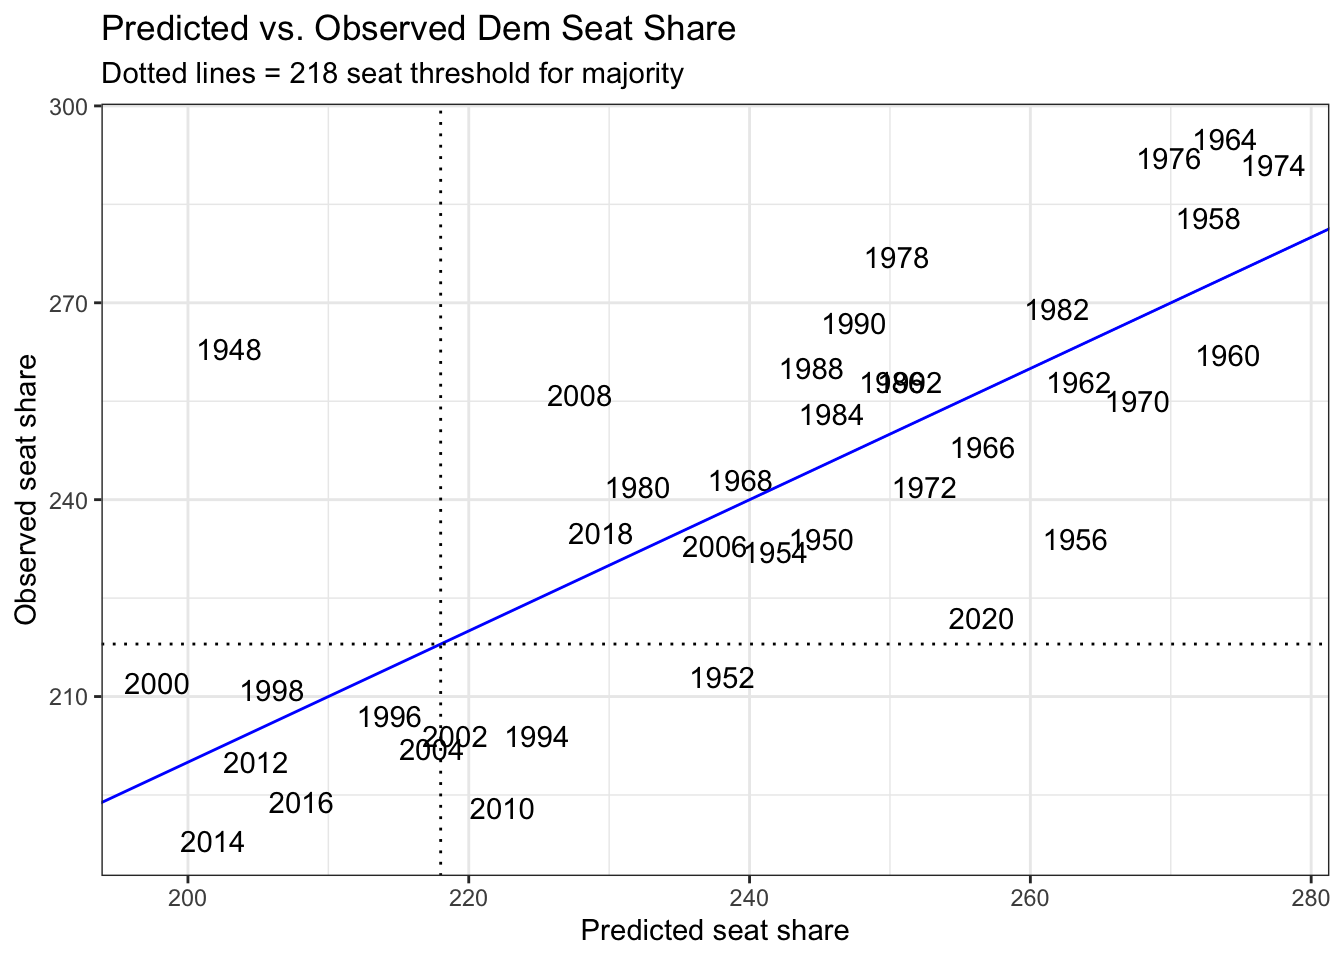
The plots above visualize the potential predictive power of the vote share and seat share models. Most of the points seem to stick somewhat close to the line, but there are of course still some outliers in each model. Nonetheless, these models appear to be stronger than other versions that I have made so far this semester. What do they predict for 2022?
##        fit      lwr      upr
## 1 50.03395 45.11606 54.95184
The vote share model predicts that Democrats will win about 50.03% of the popular vote, based on the most recent unemployment rate available (3.5%), an average of generic ballot support for Democrats from 100 days from November 8 to now, and the fact that Democrats currently hold both the House and the presidency. The upper and lower bounds are still pretty wide, which suggests this model needs more certainty to provide a better prediction. I can see this prediction coming out true if Democrats have a better than expected night, but I feel as though this prediction is now too optimistic for Democrats.
##        fit      lwr      upr
## 1 229.7193 184.7472 274.6914
As for seats, Democrats under the seat share model are expected to win about 229-230 seats, which not only means they would hold on to their House majority, they also would expand on it by 9-10 seats (based on their current majority of 220 seats). Compared to the vote share model, this prediction seems even more optimistic, especially considering most experts are anticipating Democrats to lose control of the chamber, not gain seats. To improve my models ahead of my final prediction, I will explore adding other variables and potentially tweaking my existing ones to see if I can produce models with much more precise confidence intervals and ideally more realistic predictions!