on
Blog Post 5 - The Air War
This blog is part of a series for Gov 1347: Election Analytics, a course at Harvard University taught by Professor Ryan D. Enos.
Introduction
And I approve this message.
Every two years, the election cycle comes roaring back, and everything from TV commercials to YouTube ads feature the above words candidates running for federal office are required to include at the end of some of their political advertisements. This cycle, according to the nonpartisan firm AdImpact, an astounding $9.7 billion will be dropped for political ad spending in total, higher than even the $9.0 billion spent during the 2020 presidential election and over twice as much as was spent ($4 billion) during the last midterm elections in 2018.
The two parties may be throwing their entire coffers at this election due to control of both the House and the Senate being in reach for either party, but how much does all this ad spending actually move the needle in these elections? Will it help us predict election day this year, which is 4 weeks from this post?
Looking Back at 2018
To determine how ad spending can potentially impact my forecasting for the upcoming midterms, I will go back to the data from the most recent midterm elections in 2018. Although there is already some data for ad spending for the 2022 cycle, I am choosing to use the existing data on ad spending in 2018 as a stand-in since the 2022 data is not as complete and easily accessible.
First, I wanted to get a sense of the total ad spending based on party for the months leading up to the election (August through November). The graph below represents a visualization of this ad spending.
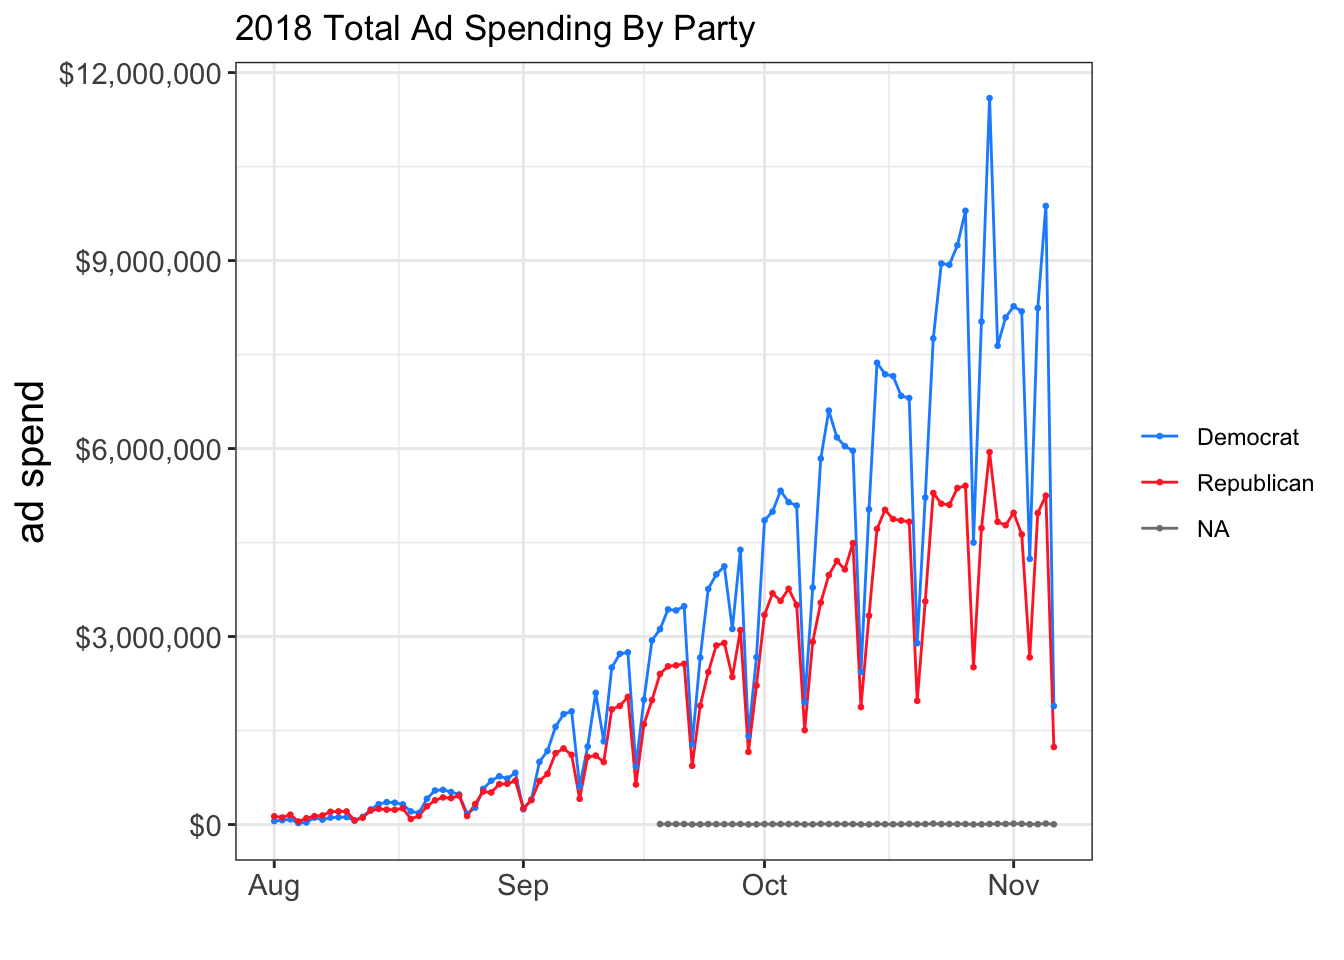
As you can see, before about mid-August, both parties are not spending too much money on political ads yet, but afterwards, spending starts to increase more and more rapidly as election day approaches, with the peak being right before November. This trend makes sense, as parties seemingly are responding to the pressure of election day getting nearer and nearer, especially for highly competitive races where the outcome could be anyone’s guess.
One interesting pattern is that each party’s spend moves together - when Democrats pour a bucket of cash into new ads, Republicans come with their own bucket to try and match the increase. In the last few months and especially around mid-October to November, you can see that Democrats outspent Republicans even when there were dips in spending (quick side question: what are these dips caused by?). The fact that Democrats outspent Republicans by quite a bit overall potentially could have contributed to their net gain of 41 seats and thus winning control of the House, but the extra spend could also be due to the fact that this was a midterm year where the incumbent president was of the opposite party, which means Democrats would want to spend more and be on the attack.
We know both parties spend more money than is probably socially responsible on their ads, but where exactly is all this money going? For each party, I decided to visualize the top 10 districts in which the most money was going.
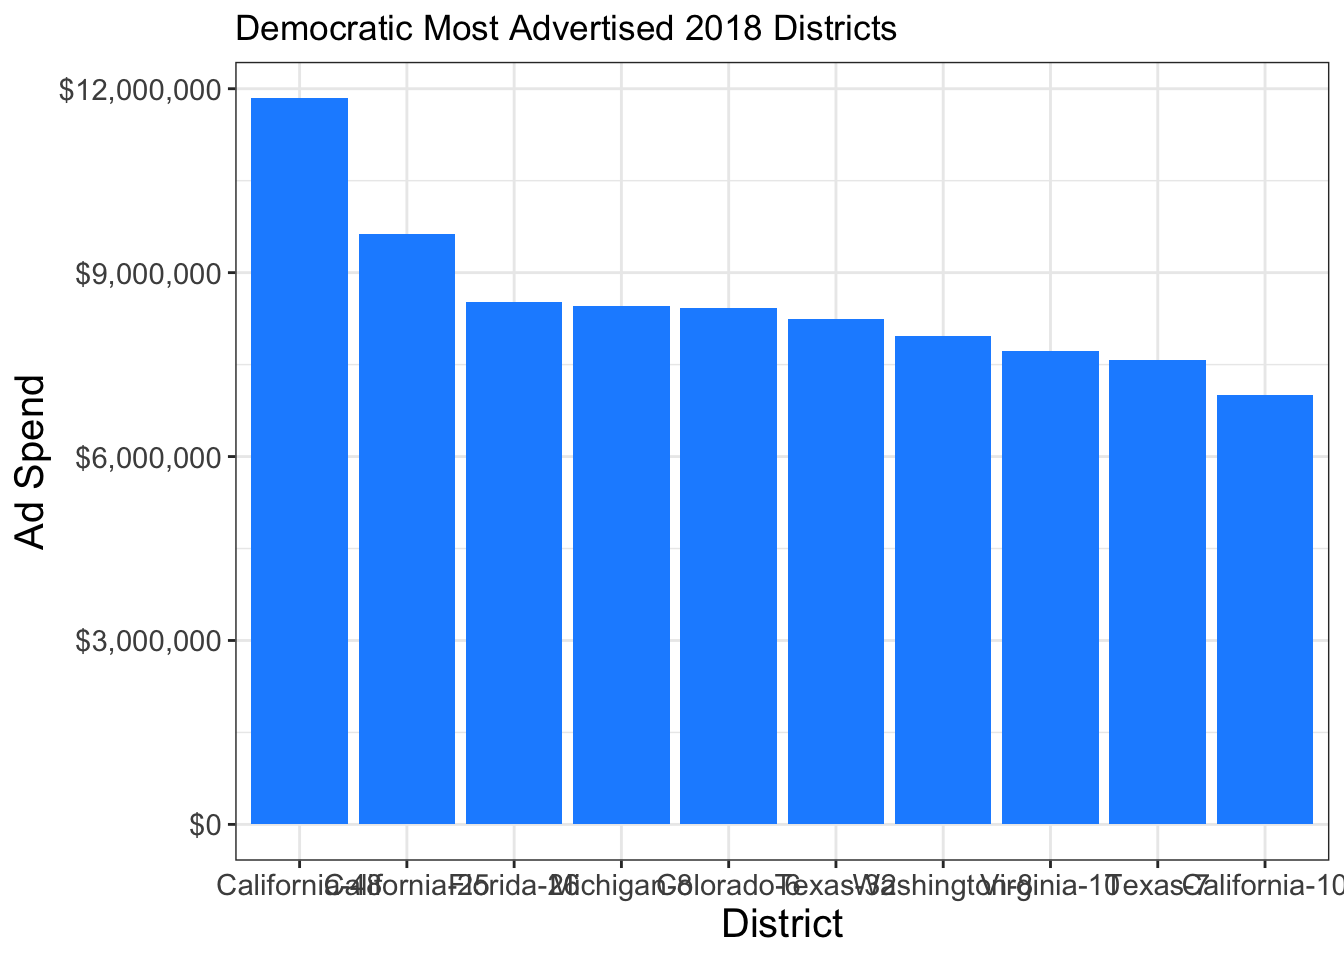
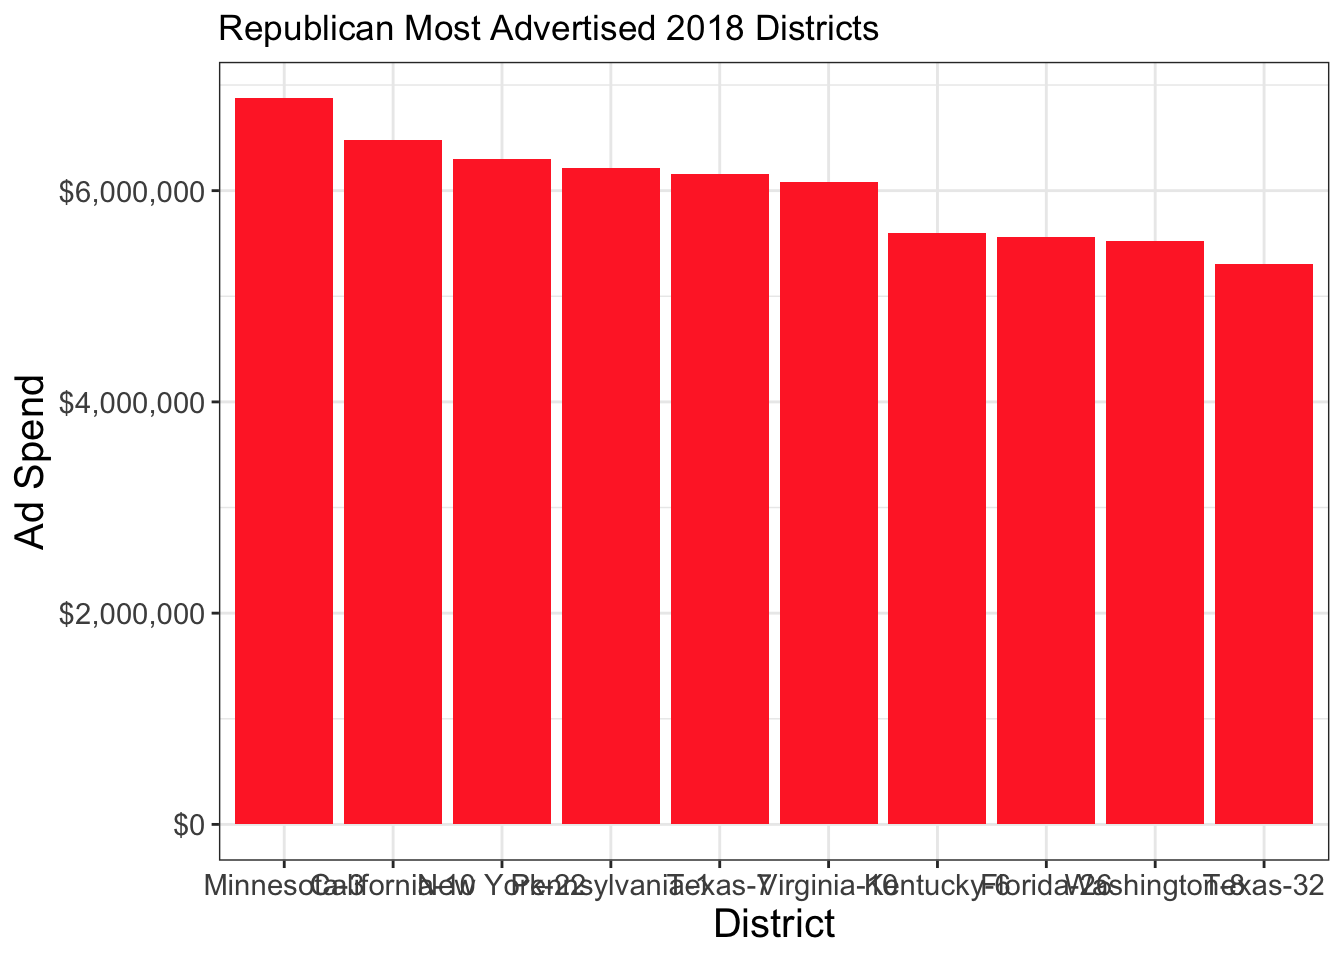
Some of the same districts like CA-10 and FL-26 appear on both graphs, but for the most part, the districts where the most money is spent don’t line up between parties as evenly as one might think. A few states show up often on both graphs, namely California, Texas, and Florida, which are all more populated states with more congressional districts than other states in the country.
Moving Forward to 2022: My Models and Their Predictions
Important note before I continue: In the past few weeks, I have been trying to forecast the 2022 election results on the national level, but beginning this week, I will provide my forecast and future updates at the congressional district level. For this week in particular, my model will focus on just ad spending and incumbency as the main variables.
For the first model, I will incorporate just total ad spending by Democrats from 2018 to predict Democratic voteshare in 2022. The second model will incorporate total ad spending by Democrats from 2018 and earlier (I am leaving out 2020 due to a lack of ad data for that year) combined with variables indicating the incumbent party and whether the seat is open.
##
## Call:
## lm(formula = DemVotesMajorPercent ~ total_cost, data = ad_pvstate_2018)
##
## Residuals:
##     Min      1Q  Median      3Q     Max
## -26.420  -2.733   0.188   2.119  49.615
##
## Coefficients:
##              Estimate Std. Error t value Pr(>|t|)
## (Intercept) 5.034e+01  1.432e-02 3516.22   <2e-16 ***
## total_cost  2.528e-08  2.201e-09   11.48   <2e-16 ***
## ---
## Signif. codes:  0 '***' 0.001 '**' 0.01 '*' 0.05 '.' 0.1 ' ' 1
##
## Residual standard error: 4.963 on 606618 degrees of freedom
##   (256 observations deleted due to missingness)
## Multiple R-squared:  0.0002174,  Adjusted R-squared:  0.0002158
## F-statistic: 131.9 on 1 and 606618 DF,  p-value: < 2.2e-16
The 2018-only ad spending model gives us a highly statistically significant result: as the total cost of Democratic ads in a district increases, the higher voteshare Democrats will receive. However, the increase is minuscule, and the adjusted R-squared is 0.0002158, which means this model explains almost none of the variance.
##        fit      lwr      upr
## 1 50.50192 40.77496 60.22888
I struggled this week to make predictions for all districts across the country with this data, so above is the model’s prediction for 2022 for the district I am following: CA-27. As of this blog post, this district is as close to a toss-up as you can get. Due to redistricting, I used the old CA-25 district as a stand-in, since the area it covers is roughly similar to the now CA-27, and it was the incumbent Mike Garcia’s old district. According to this model, Democrats will win about 50.5% of the vote in this district, which would mean Republican Mike Garcia losing this seat to the Democrats by a very narrow margin. However, the lower and upper bounds reflect much more extreme possibilities, highlighting the shakiness of this model further.
##
## Call:
## lm(formula = DemVotesMajorPercent ~ total_cost + incumbent_party +
##     open_seat, data = ad_pvstate_all)
##
## Residuals:
##     Min      1Q  Median      3Q     Max
## -27.107  -3.493   0.293   2.961  51.741
##
## Coefficients:
##                   Estimate Std. Error t value Pr(>|t|)
## (Intercept)      4.826e+01  1.157e-02 4171.22   <2e-16 ***
## total_cost       2.640e-07  1.900e-09  138.92   <2e-16 ***
## incumbent_party  4.007e-01  1.067e-02   37.54   <2e-16 ***
## open_seat       -2.254e-01  1.227e-02  -18.37   <2e-16 ***
## ---
## Signif. codes:  0 '***' 0.001 '**' 0.01 '*' 0.05 '.' 0.1 ' ' 1
##
## Residual standard error: 5.934 on 1411706 degrees of freedom
##   (20214 observations deleted due to missingness)
## Multiple R-squared:  0.01364,    Adjusted R-squared:  0.01364
## F-statistic:  6507 on 3 and 1411706 DF,  p-value: < 2.2e-16
With the incumbency variables and polling data from additional years, this model is definitely better than the latter model. All variables have a statistically significant impact. Interestingly, open_seat has a negative impact, which means a seat being open should decrease Democratic voteshare. Being a Democratic incumbent has a small positive impact for Democratic voteshare, which hints at a potential incumbency advantage for Democrats seeking reelection. Nontheless, total ad spend from Democrats still has a miniscule positive effect on Democratic voteshare.
The adjusted R-squared is 0.01364, which is still incredibly small despite the improvements from the other model. Thus, neither of this week’s models are great for producing an accurate forecast.
##        fit     lwr      upr
## 1 50.24343 38.6138 61.87307
Above is this model’s CA-27 prediction. This model predicts 50.24% of the vote for Democrats, slightly higher than the other model but still suggesting an extremely close race. The upper and lower bounds are still wide, though again, they suggest outcomes that are possible but highly unlikely.